Animated Components for Stats Sections
The numbers behind the claim, with the context that makes them believable. 6 components fit stats sections, best fit first, each with why it's here, then 3 finished blocks built around them.
Components
Ranked the way search ranks them: those made for stats sections.
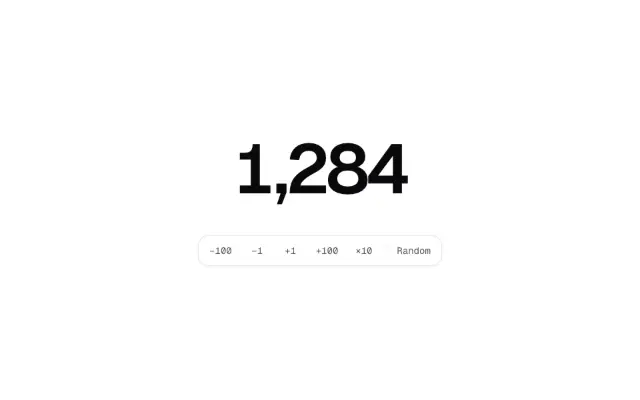
Odometer
Animated Number Counter
A number counter for stats sections: every digit rolls on its own wheel.
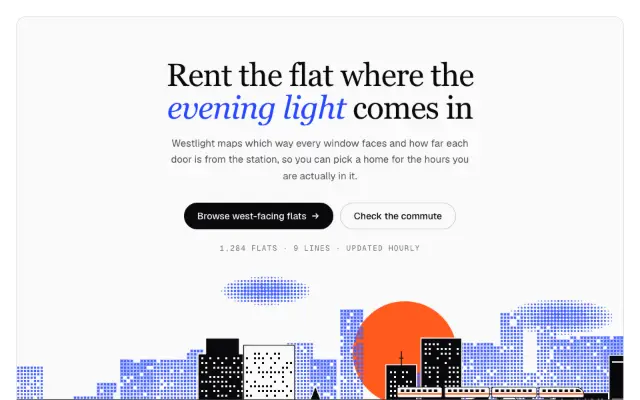
Skyline
Animated City Skyline
A chart and animated background for stats sections: towers rise and light up, and can chart your data.

Pulse
Live Data Dot Grid Background
An animated background for stats sections: each event in your feed ripples across a grid of dots.
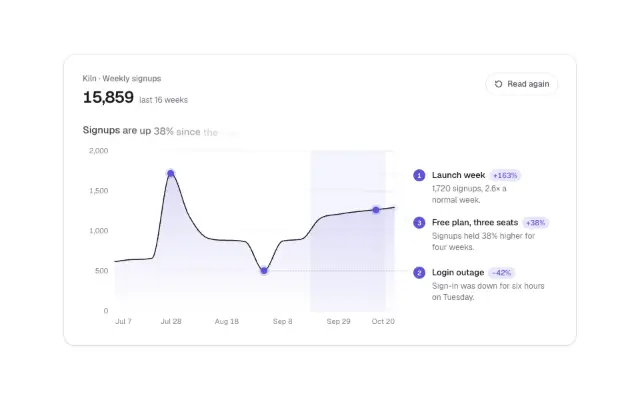
Margin Note
Annotated Line Chart
A chart for stats sections: it draws itself and notes key points in the margin.
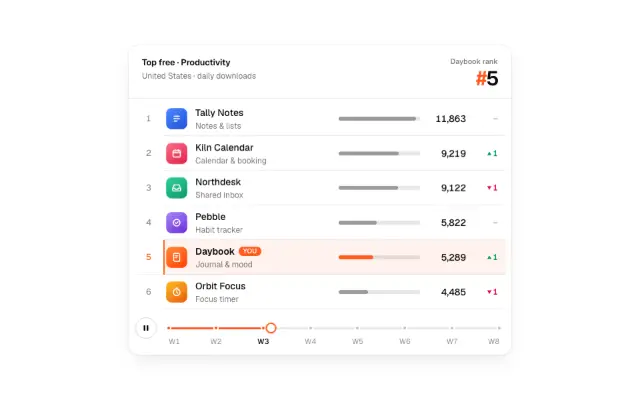
Standings
Animated Leaderboard
A leaderboard for stats sections: rows race past each other as scores change, like a timing tower.
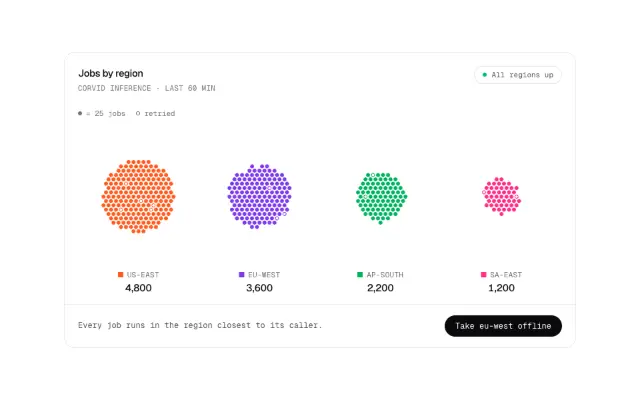
Tally
Animated Dot Chart
A chart for stats sections: every dot is a unit, and the dots that moved fly between clusters.


Blocks
Whole stats sections built around these components. Installing one brings its components with it.